
West Oxfordshire prices fell 1.5% in the year to June to £416,425, while Oxfordshire as a whole rose 3.1%. Full figures by property type and district.
The average West Oxfordshire home was worth £416,425 in June, down 1.5 per cent on the year. That is £6,271 less than the same month in 2025, according to the UK House Price Index published by HM Land Registry at 09:30 this morning.
It is the fourth month in a row that the district has recorded an annual fall. Prices were down 1.6 per cent in March, 0.5 per cent in April and 1.8 per cent in May.
The wider picture is the part worth noticing. Oxfordshire as a whole rose 3.1 per cent over the same year, and England rose 1.8 per cent. West Oxfordshire went the other way.
Every Oxfordshire district except one is rising
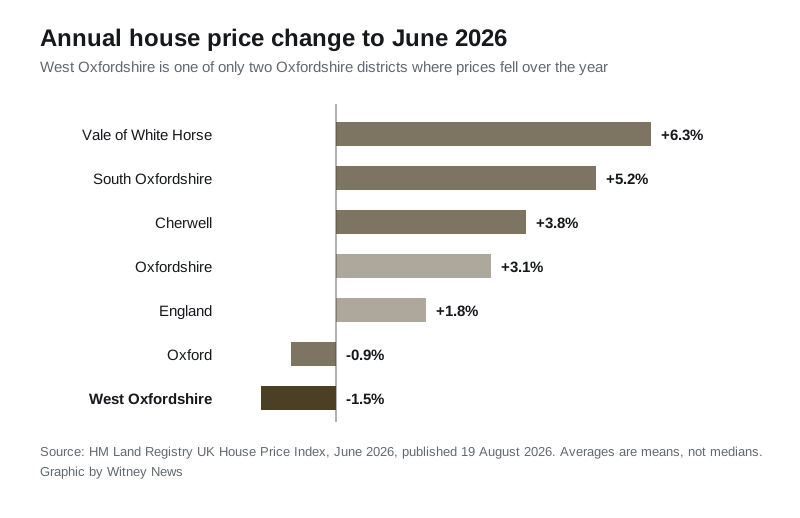
Only two of the county’s five districts fell in the year to June, and West Oxfordshire’s drop was the steeper of the pair.
| Area | Average price | Change on the year |
|---|---|---|
| Vale of White Horse | £414,441 | +6.3% |
| South Oxfordshire | £474,283 | +5.2% |
| Cherwell | £353,632 | +3.8% |
| Oxford | £466,815 | -0.9% |
| West Oxfordshire | £416,425 | -1.5% |
| Oxfordshire | £418,059 | +3.1% |
| England | £293,262 | +1.8% |
That table contains a milestone of sorts. West Oxfordshire’s average is now £1,634 below the Oxfordshire average. A year ago it was £17,155 above it. The district last sat below the county average in December 2024.
Flats fell hardest, detached homes next
The index splits the district by property type. Every type fell, but not by the same amount.
- Detached: £655,215, down 2.1 per cent
- Semi-detached: £410,068, down 0.7 per cent
- Terraced: £335,070, down 0.7 per cent
- Flats: £211,622, down 3.1 per cent
The typical first-time buyer purchase in the district was £336,087, down 1.1 per cent on the year. Buyers using a mortgage paid £412,359 on average and cash buyers £425,773.
Fewer people are moving
Sales volumes tell a slower story than prices, because HM Land Registry needs about three months to register completions. The most recent month it will publish for West Oxfordshire is April 2026, when 86 homes changed hands.
Across the year to April 2026 the district recorded 1,503 sales, against 1,690 in the year to April 2025. Treat that gap carefully rather than as a straight 11 per cent decline. The earlier window contains March 2025, when 279 homes sold in a single month as buyers rushed to complete before the stamp duty threshold changed on 1 April 2025. Only 48 sold in the month that followed. Nothing in 2026 comes close to either number: the monthly figures have sat between 86 and 98 since January.
What it means for you
If you are selling, the market you are pricing into is not the one your neighbours sold into last summer. The district average has come down £6,271 in a year while most of Oxfordshire has gone up, so an asking price anchored to a 2025 comparable in Abingdon or Thame is anchored to a different market.
If you are buying, the fall is real but modest, and it is unevenly spread. A 3.1 per cent drop on a flat is about £6,800. A 2.1 per cent drop on a detached house is about £14,000.
If you are watching the figures, two caveats matter and neither is small.
- The UKHPI average is a mean, not a median. A handful of large sales in a month pulls it upward, and West Oxfordshire registers fewer than 100 sales in a typical month now, so a single month is a wobble rather than a trend.
- The index revises. May’s figure was published last month as £417,246 and a 2.4 per cent annual fall. In today’s release the same month reads £419,805 and a 1.8 per cent fall. April moved from £419,012 to £421,212. Both revisions went upward, which is worth remembering before treating this month’s 1.5 per cent as settled.
Nationally, 62 of England’s 295 local authority districts recorded an annual fall in June. West Oxfordshire’s was the 33rd steepest, and the 20th steepest once London, where the sharpest falls are concentrated, is set aside.
The next release, covering July 2026, is due on 16 September.
Sources
- UK House Price Index, West Oxfordshire, June 2026, HM Land Registry
- UK House Price Index full data file, June 2026, HM Land Registry, used for the district comparison, property type splits, sales volumes and national ranking
- UK House Price Index full data file, May 2026, HM Land Registry, used for the revised April and May figures
Land Registry data is published under the Open Government Licence. For sale prices in Witney’s own postcodes rather than the whole district, see our Witney house prices page. Applications shaping the district’s next homes are tracked on our Witney planning news page.
Update, 16 September 2026: HM Land Registry’s July release revised West Oxfordshire’s June 2026 average to £414,825, a fall of 1.9 per cent on the year rather than the 1.5 per cent first published. The figures above are as first published. The July figures are in our July house prices report.
Have your say