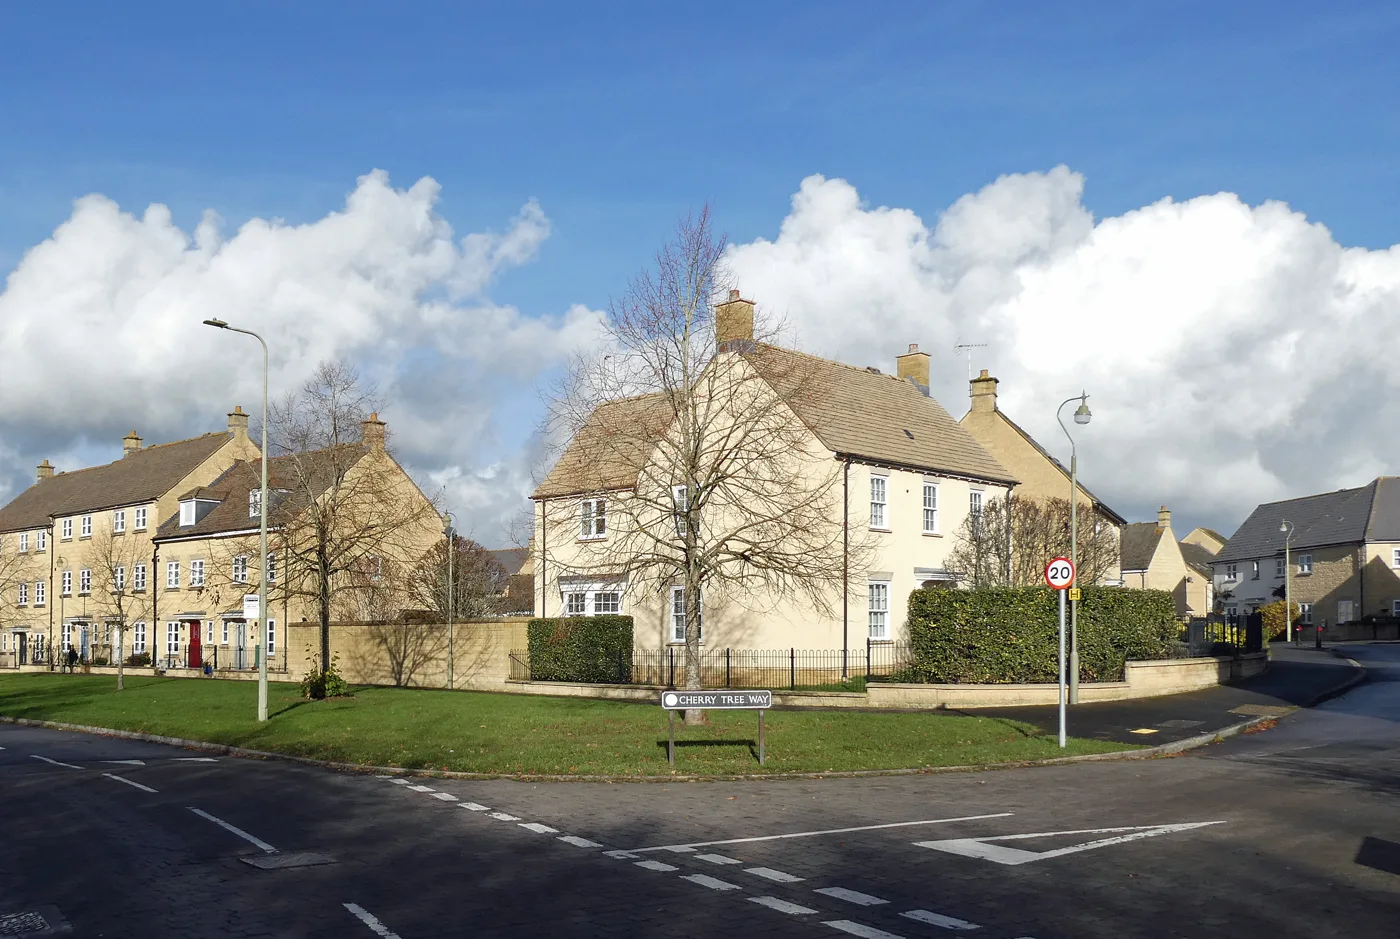

The average West Oxfordshire home was £418,586 in July, down 1.6% on the year, the fifth month of annual falls, while Oxfordshire as a whole rose 2.4%.
The average West Oxfordshire home was worth £418,586 in July, down 1.6 per cent on the year. That is £6,696 less than in July 2025, according to the UK House Price Index published by HM Land Registry this morning.
It is the fifth month in a row that the district has shown an annual fall. In today’s revised figures the run reads:
- March: down 1.7 per cent
- April: down 0.6 per cent
- May: down 2.1 per cent
- June: down 1.9 per cent
- July: down 1.6 per cent
There is one small piece of better news for sellers. Prices rose 0.9 per cent between June and July, from £414,825 to £418,586. One month does not make a turn, and the section on revisions below explains why.
Most of Oxfordshire is still rising
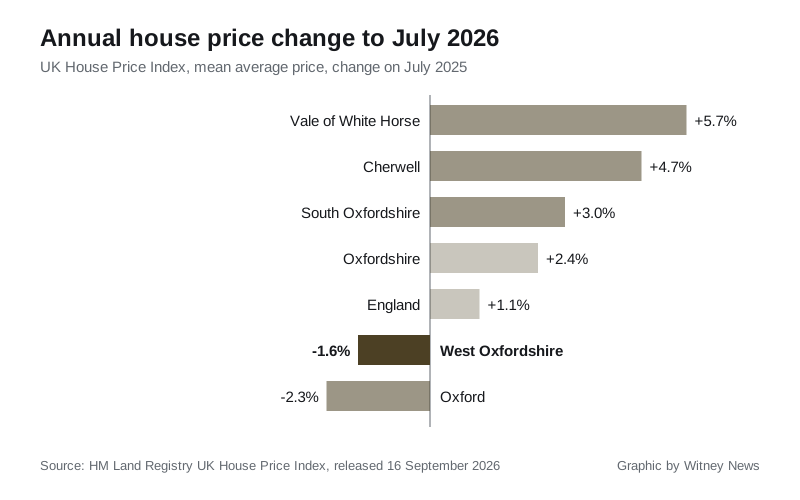
Three of the county’s five districts went up over the year. Oxford and West Oxfordshire went down.
| Area | Average price | Change on the year |
|---|---|---|
| Vale of White Horse | £413,773 | +5.7% |
| Cherwell | £356,935 | +4.7% |
| South Oxfordshire | £476,026 | +3.0% |
| West Oxfordshire | £418,586 | -1.6% |
| Oxford | £471,667 | -2.3% |
| Oxfordshire | £420,093 | +2.4% |
| England | £293,479 | +1.1% |
The gap with the Vale has almost closed
The comparison with Vale of White Horse, the district to the south across the Thames, shows how far the two markets have moved apart.
- July 2025: West Oxfordshire £425,282, Vale of White Horse £391,403. A gap of £33,879.
- July 2026: West Oxfordshire £418,586, Vale of White Horse £413,773. A gap of £4,813.
West Oxfordshire is also £1,507 below the Oxfordshire average, for the second month running. A year ago it was £14,845 above. That is less of a milestone than it sounds. The district has crossed the county line several times in the past two years, most recently in December 2024.
The district’s high point in the index was £436,278 in September 2025. July’s figure is £17,692 below that, a fall of 4.1 per cent over ten months.
Flats fell hardest
Every property type is down on the year.
- Detached: £659,741, down 1.6 per cent
- Semi-detached: £412,427, down 0.6 per cent
- Terraced: £336,966, down 1.1 per cent
- Flats and maisonettes: £211,314, down 4.3 per cent
The average first-time buyer paid £337,395, down 1.5 per cent. Buyers with a mortgage paid £414,525 on average, and cash buyers £427,924.
Nationally, 85 of England’s 295 local authority districts recorded an annual fall in July. West Oxfordshire’s was the 45th steepest. Outside London it was the 28th steepest of 64.
Sales volumes lag by two months
Land Registry needs time to register completions, so the latest sales figure for West Oxfordshire is for May 2026. It records 96 sales that month, against 105 in May 2025. Every month of 2026 so far has registered between 87 and 110 sales. Last autumn the monthly figure ran between 150 and 177.
What it means for you
If you are selling, local prices are still lower than a year ago and lower than their peak last September. A valuation based on a sale from autumn 2025 is likely to be optimistic. Price against recent sales on your own street rather than the district average.
If you are buying, the fall is modest in cash terms but real, and flats have dropped most. A 4.3 per cent fall on the average flat is about £9,500 over the year.
If you are following the figures, keep two things in mind.
- The UKHPI average is a mean, not a median. A few expensive sales can lift it in a month. With around 100 sales a month in the district, one month’s change is not a trend.
- The index revises, and it moved down this time. Last month we reported June at £416,425, down 1.5 per cent. Today’s release puts June at £414,825, down 1.9 per cent. May moved from £419,805 to £418,587.
The next release, covering August 2026, is due in October. For sold prices in Witney’s own postcodes rather than the whole district, see our Witney house prices page. The other monthly figure on the local economy is the claimant count, where under-25 claims in West Oxfordshire rose 24 per cent in the year to August.
Sources
- UK House Price Index, West Oxfordshire, July 2025 to July 2026, HM Land Registry
- UK House Price Index for July 2026, HM Land Registry release, published 16 September 2026
- UK House Price Index full data file, July 2026, HM Land Registry, used for the district comparison, property type splits, revised earlier months, sales volumes and the national ranking
Land Registry data is published under the Open Government Licence.
Have your say