
The average West Oxfordshire home was £422,009 in September, down 3.0% on the year, the steepest fall in Oxfordshire. Flats fell furthest, by 5.6%.
The average West Oxfordshire home was worth £422,009 in September, down 3.0 per cent on the year. That is £13,249 less than in September 2025. The figures come from the UK House Price Index, published by HM Land Registry on 18 November.
It is the steepest annual fall of Oxfordshire’s five districts. It is also the steepest the district has recorded since May 2024.
Overview
- Average price: £422,009 in September 2026.
- On the year: down £13,249, or 3.0 per cent.
- On the month: up 1.1 per cent from £417,298 in August.
- Oxfordshire as a whole: up 0.7 per cent, to £422,344.
- Seventh month running of annual falls in West Oxfordshire, starting in March.
Why the annual fall looks bigger this month
Part of the drop is the comparison point. September 2025 was the district’s high point in the index, at £435,258. Prices jumped 2.2 per cent that month alone.
So September 2026 is being measured against the peak. The month itself was not a bad one: prices rose 1.1 per cent from August, the biggest monthly rise since September last year.
The recent run of annual changes, from the revised figures:
- March: down 2.1 per cent
- April: down 1.0 per cent
- May: down 2.6 per cent
- June: down 2.1 per cent
- July: down 1.7 per cent
- August: down 2.0 per cent
- September: down 3.0 per cent
How the county compares
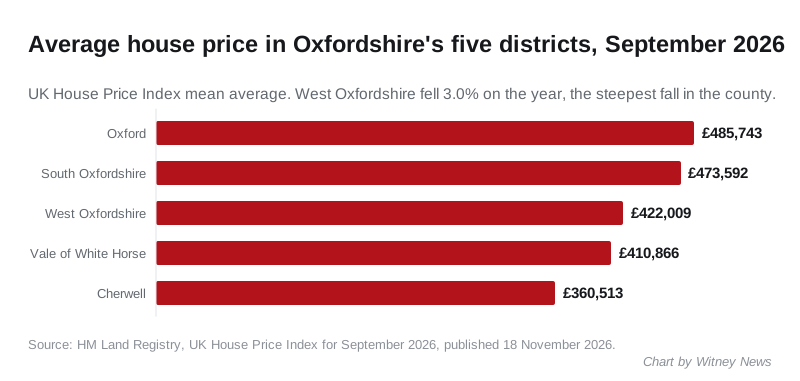
Three of Oxfordshire’s five districts rose over the year. Oxford and West Oxfordshire fell.
| Area | Average price | Change on the year |
|---|---|---|
| Oxford | £485,743 | −2.2% |
| South Oxfordshire | £473,592 | +2.2% |
| West Oxfordshire | £422,009 | −3.0% |
| Vale of White Horse | £410,866 | +2.0% |
| Cherwell | £360,513 | +2.5% |
| Oxfordshire | £422,344 | +0.7% |
| South East | £378,915 | −0.2% |
| England | £292,998 | +0.8% |
West Oxfordshire’s neighbour to the west, Cotswold district, fell almost as far: down 2.9 per cent to £424,819.
The district now sits £335 below the Oxfordshire average. It has crossed that line several times in the past two years, so it is not a milestone in itself.
Nationally, 108 of England’s 295 local authority districts recorded an annual fall in September. Only 24 fell faster than West Oxfordshire, and 15 of those were London boroughs.
Every type of home is down
- Detached: £664,976, down 2.9 per cent
- Semi-detached: £416,253, down 2.1 per cent
- Terraced: £339,701, down 2.9 per cent
- Flats and maisonettes: £212,598, down 5.6 per cent
First-time buyers paid £340,227 on average, down 2.9 per cent. Buyers with a mortgage paid £418,023 and cash buyers £431,181.
Sales are running well below last year
Land Registry needs time to register completions, so the latest sales count for the district is July 2026. It records 111 sales that month, against 156 in July 2025.
What it means for you
If you are selling, your home is likely to be worth less than a valuation from last autumn suggests. The district average is about 3 per cent below its September 2025 peak. Price against what has sold on your own street recently.
If you are buying, flats have fallen furthest. A 5.6 per cent fall on the average flat is roughly £12,700 over the year.
If you are following the figures, keep two things in mind.
- The UKHPI average is a mean, not a median. A handful of expensive sales can lift it in a month. With around 100 sales a month in the district, one month’s change is not a trend.
- The index revises. August now reads £417,298, down 2.0 per cent, after first being published at £416,123, down 2.3 per cent. July, which we reported at £418,586, now reads £417,917. The September 2025 peak has also been revised, from £436,278 to £435,258.
For what homes in Witney’s own postcodes actually sold for, rather than the district average, see our page on Witney house prices.
The October figures are due in December.
Sources
- UK House Price Index for September 2026, HM Land Registry, published 18 November 2026
- UK House Price Index full data file, September 2026, HM Land Registry, used for the district comparison, property type figures, revised earlier months, sales volumes and the national ranking
Land Registry data is published under the Open Government Licence.
Have your say