

West Oxfordshire had 1,405 people on the claimant count in October, up 35 in a month. Women still outnumber men, the only such council in the South East.
1,405 people in West Oxfordshire were on the claimant count in October 2026. That is up 35 on September and up 75 on October last year.
Women still outnumber men: 730 against 675. West Oxfordshire remains the only one of the South East’s 64 council areas where that is true.
The figures are the Office for National Statistics claimant count on Nomis, published on 17 November. The claimant count measures people claiming benefits mainly because they are out of work or on low earnings.
The numbers
| October 2025 | September 2026 | October 2026 | Change on the year | |
|---|---|---|---|---|
| Women | 670 | 715 | 730 | +60 (+9.0%) |
| Men | 660 | 655 | 675 | +15 (+2.3%) |
| All | 1,330 | 1,370 | 1,405 | +75 (+5.6%) |
The ONS rounds every figure to the nearest five, so small moves can be rounding.
The September figures in this table are the revised ones. We reported 1,405 for September last month; the ONS has since lowered it to 1,370. A note on our September story explains the change.
By age
Every age group is higher than a year ago:
- 16 to 24: 260, up from 230
- 25 to 49: 795, up from 775
- 50 and over: 345, up from 325
The young adult group rose the fastest, by 13% over the year.
Witney and Carterton wards
Witney’s five wards went the other way to the district in October. They had 410 claimants, down from 425 in September.
Witney Central still has the highest claimant rate of any ward in West Oxfordshire, at 2.9% of residents aged 16 to 64. Burford is next, at 2.8%.
Carterton’s three wards rose from 195 to 220.
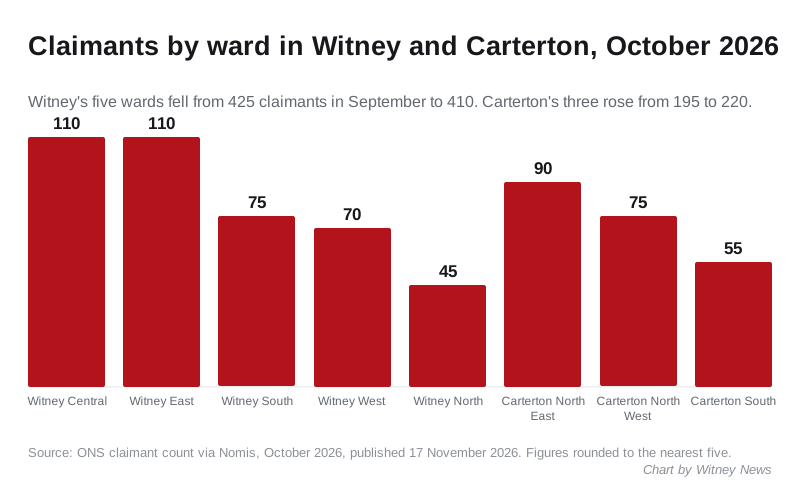
| Ward | September 2026 | October 2026 | Rate |
|---|---|---|---|
| Witney Central | 115 | 110 | 2.9% |
| Witney East | 115 | 110 | 2.2% |
| Witney South | 85 | 75 | 1.9% |
| Witney West | 75 | 70 | 1.5% |
| Witney North | 35 | 45 | 1.9% |
| Carterton North East | 75 | 90 | 2.1% |
| Carterton North West | 70 | 75 | 2.1% |
| Carterton South | 50 | 55 | 2.1% |
Chipping Norton ward had 90 claimants, a rate of 2.1%. Woodstock and Bladon had 60, a rate of 2.0%.
Against the rest of Oxfordshire
Over the year, West Oxfordshire’s rise of 75 was the second largest in the county, after Oxford’s:
- Oxford: up 120, to 3,135
- West Oxfordshire: up 75, to 1,405
- Vale of White Horse: up 20, to 1,860
- South Oxfordshire: down 30, to 1,760
- Cherwell: down 70, to 2,510
Oxfordshire as a whole rose 110, to 10,665. The district figures do not add exactly to the county total because of rounding.
Still one of the lowest rates around
The rise starts from a low base. West Oxfordshire’s claimants are 1.9% of residents aged 16 to 64. That compares with:
- 2.2% across Oxfordshire
- 3.2% across the South East
- 3.9% across the UK
What it means for you
If you have lost work or your hours have been cut, you may be able to claim Universal Credit. The government’s benefits calculator page lists free, independent calculators.
The Jobcentre Plus finder gives the address and opening hours of your nearest office.
Sources
- Claimant count by sex and age, West Oxfordshire, wards and comparison areas, ONS via Nomis, October 2026
- Labour market overview, UK: November 2026, ONS, 17 November 2026
Have your say