
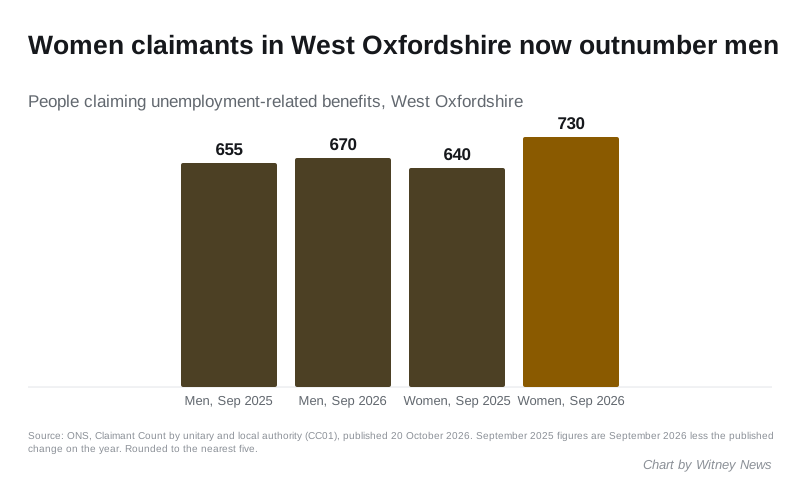
Women claimants in West Oxfordshire rose 14% in a year to 730, overtaking men. No other South East council has more women than men claiming.
More women than men are now claiming unemployment-related benefits in West Oxfordshire. In September there were 730 women and 670 men on the claimant count. West Oxfordshire is the only one of the South East’s 64 council areas where women outnumber men.
The figures come from the Office for National Statistics claimant count table for every local authority, published on 20 October. They cover the second Thursday of September.
A year ago the position was the other way round. The ONS change-on-year figures put women at 640 and men at 655 in September 2025.
The numbers
| Sep 2025 | Sep 2026 | Change | Share of residents aged 16 to 64 | |
|---|---|---|---|---|
| Women | 640 | 730 | +90 (+14.1%) | 2.0% |
| Men | 655 | 670 | +15 (+2.3%) | 1.9% |
| All | 1,295 | 1,405 | +110 (+8.5%) | 1.9% |
ONS rounds every figure to the nearest five. That is why women and men add up to 1,400 rather than 1,405. The September 2025 figures are this year’s totals less the change on the year that ONS publishes alongside them.
How unusual that is
Across the UK, men on the claimant count outnumber women by about 951,000 to 752,000. Of 361 council areas in the ONS table, only 10 have more women than men claiming.
The others are:
- Rutland, East Cambridgeshire and Uttlesford in the East and East Midlands
- South Hams and Stroud in the South West
- Barking and Dagenham in London
- Armagh City, Banbridge and Craigavon, Mid Ulster, and Newry, Mourne and Down in Northern Ireland
The rise among women is also steep by national standards. A 14.1% increase is the tenth largest for women in any UK council area. Across the UK the number of women claiming rose 1.6% over the year, and across the South East 2.8%.
The ONS table does not say why. It does not break the figures down by family type or the benefit claimed.
By age, and across Witney’s wards
Updated 25 October: the age and ward figures in this section come from the ONS claimant count on Nomis, which could not be reached when we first published.
Every age group rose over the year. The youngest and oldest claimants rose fastest.
| Age | September 2025 | August 2026 | September 2026 |
|---|---|---|---|
| 16 to 24 | 225 | 255 | 260 |
| 25 to 49 | 765 | 740 | 800 |
| 50 and over | 305 | 345 | 345 |
| All ages | 1,295 | 1,340 | 1,405 |
The month’s rise was almost all among people aged 25 to 49: up 60, against 5 among 16 to 24s and none among the over-50s.
Witney’s five wards had 440 claimants in September, up from 400 in August. Witney Central has the highest claimant rate of any ward in West Oxfordshire, at 3.1% of working-age residents. Burford is next, at 2.5%.
| Ward | August 2026 | September 2026 | Rate |
|---|---|---|---|
| Witney Central | 100 | 120 | 3.1% |
| Witney East | 110 | 120 | 2.4% |
| Witney South | 80 | 90 | 2.3% |
| Witney West | 65 | 70 | 1.6% |
| Witney North | 45 | 40 | 1.7% |
The ONS rounds these figures to the nearest five, so small monthly moves can be rounding. Nomis carries no September 2025 figures for these wards, so there is no year-on-year comparison by ward.
West Oxfordshire against the rest of the county
The district’s overall rise of 110 is bigger than the rise for Oxfordshire as a whole, which was 40. Two of the county’s five districts went down.
- West Oxfordshire: up 110, to 1,405 (up 8.5%)
- Vale of White Horse: up 5, to 1,835
- Oxford: up 5, to 3,095
- South Oxfordshire: down 15, to 1,755
- Cherwell: down 65, to 2,490
The split by sex is starker. Women claiming across Oxfordshire fell by 55 over the year. In West Oxfordshire they rose by 90.
For comparison, the claimant count rose 2.6% across England and 4.0% across the South East.
Still one of the lowest rates in the region
The rise starts from a low base. West Oxfordshire’s 1,405 claimants are 1.9% of residents aged 16 to 64. That compares with:
- 2.2% across Oxfordshire
- 3.1% across the South East
- 3.9% across the UK
Only Hart, on 1.7%, has a lower rate among the 64 South East authorities. South Oxfordshire and Mole Valley share West Oxfordshire’s 1.9%.
Last month we reported 1,360 claimants for August, from the first estimate. ONS revises the previous month in each release, so we have not worked out a month-on-month change.
What the claimant count measures
It is not the unemployment rate. The ONS quality and methodology note says the count covers people on Jobseeker’s Allowance and people on Universal Credit who are required to look for work. Under Universal Credit that includes some people in work on low earnings.
ONS labels the local authority figures “official statistics in development”. A change of 90 on a base of 640 is a real movement. A change of five or ten is within the rounding.
What it means for you
- If you are looking for work in the Witney area, Oxfordshire vacancies are on the government’s Find a job service, and your nearest Jobcentre is on the Jobcentre Plus contact page.
- If you have just lost hours or a job, check whether you can claim with the government’s benefits calculators before you apply.
- If you want free advice on benefits or debt, Citizens Advice runs a service in Witney. Its district council funding was decided in September.
- If you employ people locally, more people are claiming and looking for work than a year ago, while the district’s rate is still among the lowest in the South East.
The next release, covering October, is due on 17 November. For the district’s other monthly economic figure, see our report on West Oxfordshire house prices.
Sources
- Claimant Count by unitary and local authority (CC01), Office for National Statistics, published 20 October 2026, September 2026 figures for West Oxfordshire, the Oxfordshire districts, the 64 South East authorities, the South East, England and the UK
- Claimant count by age and by ward (NM_162_1), ONS via Nomis, September 2025, August 2026 and September 2026
- Claimant Count quality and methodology information, Office for National Statistics
Correction, 18 November 2026: the ONS has revised the September 2026 claimant count for West Oxfordshire. The total is now 1,370, not 1,405, with 715 women and 655 men rather than 730 and 670. Women still outnumber men, and West Oxfordshire is still the only South East council area where that is so. The figures above are as first published on 20 October. Our October story uses the revised numbers.
Have your say