

Police logged 154 crimes in central Witney in September, up from a two-year low of 100 in August. Over 12 months crime fell 14%, while Carterton's rose 15%.
Police recorded 154 crimes and anti-social behaviour reports within a mile of central Witney in September 2026. That is up from 100 in August, which was the lowest month in two years.
September was still quieter than a year earlier. In September 2025 the same area recorded 178 reports.
The figures are the street-level data Thames Valley Police supplies to police.uk. We downloaded them through the data.police.uk API on 15 November. September 2026 is the latest month published.
The month in numbers
| Type of crime | September 2025 | August 2026 | September 2026 |
|---|---|---|---|
| Violence and sexual offences | 87 | 44 | 62 |
| Anti-social behaviour | 22 | 13 | 26 |
| Shoplifting | 28 | 8 | 17 |
| Public order | 10 | 8 | 11 |
| Other theft | 9 | 12 | 11 |
| Criminal damage and arson | 10 | 4 | 9 |
| Bicycle theft | 1 | 0 | 4 |
| Vehicle crime | 2 | 5 | 4 |
| Burglary | 2 | 2 | 3 |
| Drugs | 2 | 2 | 3 |
| Other crime | 2 | 2 | 2 |
| Robbery | 3 | 0 | 1 |
| Possession of weapons | 0 | 0 | 1 |
| All reports | 178 | 100 | 154 |
Violence and sexual offences, the largest category in any town centre, rose from 44 to 62. Anti-social behaviour doubled, from 13 to 26, and shoplifting went from 8 to 17.
Each of those is still below September 2025. Violence and sexual offences were 87 then, and shoplifting 28.
Police.uk lists 12 of September’s 17 shoplifting reports as closed with no suspect identified. The other 5 are still under investigation. Of the 62 violent and sexual offences, 43 are listed as under investigation.
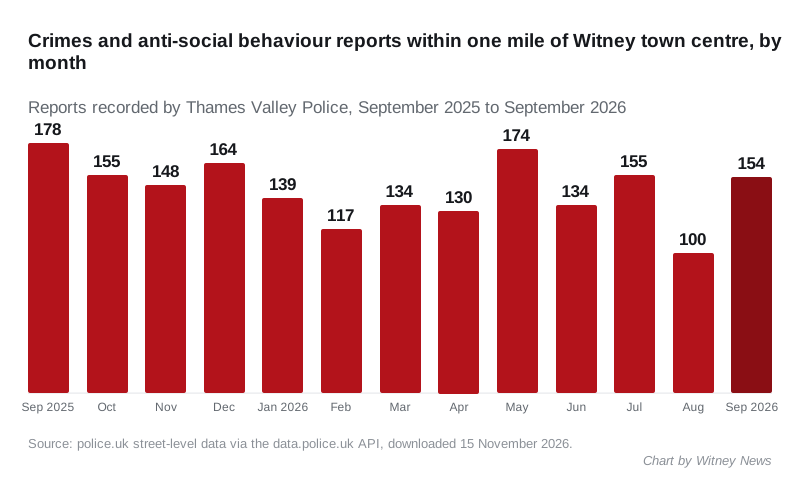
The year: down 14%
One month can mislead, so we also compared the 12 months to September 2026 with the 12 months before. Both periods use the same one-mile circle around Witney town centre.
| Type of crime | Oct 2024 to Sep 2025 | Oct 2025 to Sep 2026 | Change |
|---|---|---|---|
| All reports | 1,992 | 1,704 | down 14% |
| Violence and sexual offences | 879 | 683 | down 22% |
| Anti-social behaviour | 295 | 231 | down 22% |
| Shoplifting | 216 | 204 | down 6% |
| Public order | 150 | 168 | up 12% |
| Criminal damage and arson | 156 | 123 | down 21% |
| Other theft | 98 | 101 | up 3% |
| Vehicle crime | 34 | 40 | up 18% |
| Burglary | 35 | 36 | level |
| Drugs | 38 | 25 | down 34% |
| Robbery | 14 | 20 | up 43% |
Most of the fall is in violence and anti-social behaviour, both down by more than a fifth. Public order offences and robbery rose. Robbery is a small category, so six more reports over a year moves the percentage a long way.
Carterton: up 15% in a year
We ran the same check for a one-mile circle around Carterton town centre, about five miles west of Witney. Recorded crime there rose from 716 to 825 over the same two periods, up 15%.
The main movements were:
- violence and sexual offences up 13%, from 342 to 388
- criminal damage and arson up 47%, from 55 to 81
- anti-social behaviour up 20%, from 86 to 103
- shoplifting down 17%, from 72 to 60
Carterton recorded 70 reports in September 2026, against 47 in September 2025. Violence and sexual offences accounted for 41 of them, up from 20 a year earlier.
How to read these figures
- The counts are crimes reported to and recorded by police, not every crime committed. A change can reflect reporting or recording as well as offending.
- Police.uk places each report at an anonymised map point near where it happened, so a one-mile circle is approximate at its edges.
- Monthly totals can be revised. Carterton’s July and August totals both read 88 in this download, against 89 when we published the August figures. Witney’s August total of 100 is unchanged.
- Anti-social behaviour is recorded as an incident, not a crime, but police.uk counts it alongside crime, and so do we.
What it means for you
- Report anti-social behaviour and non-emergency crime to Thames Valley Police online or on 101. Call 999 if someone is in danger or a crime is happening now.
- Shops can report thefts online too. Thefts that never reach the police do not appear in these figures.
- Your own street’s figures, and your neighbourhood policing team, are on police.uk. Enter a postcode to see the map.
October’s figures are due on police.uk in December, and we will update the comparison then.
Have your say