
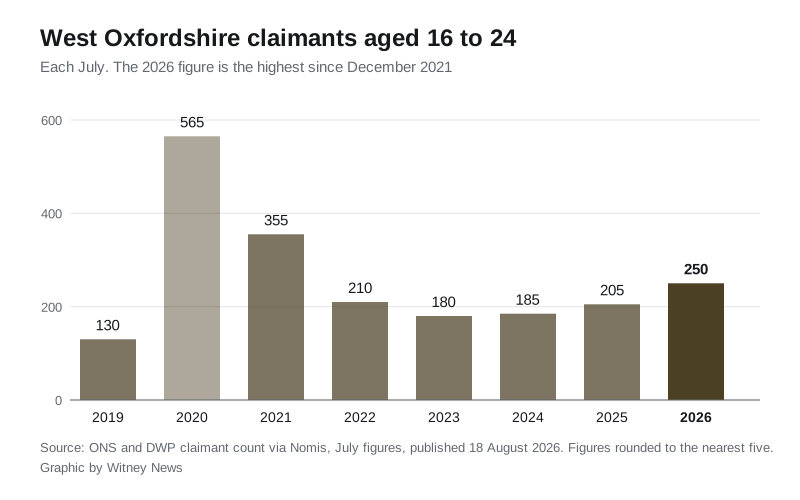
250 people aged 16 to 24 in West Oxfordshire were claiming in July, the most since December 2021. It is the only Oxfordshire district where young claims rose.
250 people aged 16 to 24 in West Oxfordshire were claiming unemployment benefits in July, the highest figure for that age group since December 2021. That is up from 205 a year earlier, a rise of 22 per cent.
The figures come from the claimant count, compiled by the Office for National Statistics and the Department for Work and Pensions, and were published on 18 August.
The district as a whole barely moved. 1,350 people of all ages were claiming in July, 40 more than in July 2025. That is 1.9 per cent of residents aged 16 to 64, and it leaves West Oxfordshire with one of the lowest claimant rates in the South East.
Almost all of the year’s increase sat in one age band.
Change over the year to July 2026:
- aged 16 to 24: 205 to 250, up 45
- aged 25 to 49: 775 to 760, down 15
- aged 50 and over: 325 to 345, up 20
No other Oxfordshire district saw young claims rise
West Oxfordshire is the only one of the county’s five districts where the number of under-25 claimants went up over the year:
- West Oxfordshire: 205 to 250, up 22.0%
- Vale of White Horse: 295 to 295, no change
- Cherwell: 365 to 360, down 1.4%
- South Oxfordshire: 255 to 250, down 2.0%
- Oxford: 490 to 470, down 4.1%
The national direction of travel is upwards, so West Oxfordshire is not an outlier for rising. It is an outlier for the speed. Under-25 claims across the UK rose 9.7 per cent over the year, from 302,835 to 332,335. Across the South East they rose 12.2 per cent, from 31,090 to 34,885. West Oxfordshire rose at roughly twice the UK rate.
Ranked against all 64 local authorities in the South East, the district had the 13th steepest increase in under-25 claims. Surrey Heath was top on 39.5 per cent, followed by Tonbridge and Malling on 34.3 per cent and Sevenoaks on 34.1 per cent.
The district is still one of the least affected in the region
None of that changes the wider picture, which is a low-claimant district. West Oxfordshire’s overall rate of 1.9 per cent compares with 3.1 per cent across the South East and 3.9 per cent across the UK.
Of the 64 South East authorities, only Hart in Hampshire is lower, on 1.8 per cent. West Oxfordshire is one of five tied on 1.9 per cent, alongside Horsham, Mole Valley, South Oxfordshire and Waverley.
Where the claimants are
Ward figures are published for all ages together, and the numbers for young people alone are too small to break down reliably. Across all ages, the spread between wards in West Oxfordshire is narrow by the standards of most districts:
| Ward | Claimants | Rate |
|---|---|---|
| Witney Central | 100 | 2.5% |
| Carterton North West | 85 | 2.4% |
| Burford | 25 | 2.3% |
| Alvescot and Filkins | 25 | 2.3% |
| Witney East | 110 | 2.2% |
| Chipping Norton | 95 | 2.2% |
| Hailey, Minster Lovell and Leafield | 55 | 2.2% |
| Milton-under-Wychwood | 10 | 0.8% |
Witney East has the largest number of claimants of any ward in the district, at 110. Witney Central has the highest rate, at 2.5 per cent. The lowest is Milton-under-Wychwood on 0.8 per cent. A gap of roughly three to one between the top and bottom ward is modest: in several districts we have looked at across the network the gap runs to six or ten to one.
The 27 ward totals add up to 1,345 against a district figure of 1,350, which is the effect of rounding rather than a missing ward.
What the claimant count actually measures
Two things are worth keeping in mind before reading too much into any of these numbers.
It is not the unemployment rate. The ONS is explicit in its quality and methodology note: “The Claimant Count does not attempt to measure unemployment, which is a concept defined by the International Labour Organisation (ILO) as all those who are out of work, actively seeking work and available to start work.” The count is a composite of people claiming Jobseeker’s Allowance and people claiming Universal Credit who are required to seek work. As the ONS puts it, “Some part-time workers, with very low earnings, may be eligible while seeking full-time work.”
Everything is rounded to the nearest five. On a base of 250 people, a change of 45 is real, but a month-to-month wobble of five or ten is not worth reading as a trend.
What it means for you
- If you are 16 to 24 and out of work in the Witney area, you are not an unusual case this year. The number of people in your position locally is at its highest since 2021, and 45 more than a year ago. Support routes are set out on the government’s Jobcentre Plus contact page, and vacancies across Oxfordshire are listed on Find a job.
- If you are hiring locally, the pool of younger applicants is larger than it has been for four years, while the pool of people aged 25 to 49 has shrunk slightly.
- If you are reading this as a sign of a downturn, be careful. The district total rose by 40 over the year and the overall rate is among the lowest in the South East. What has changed is the age profile of who is claiming, not the scale.
- Next release. The claimant count is published monthly, usually on the third Tuesday. The August figures are due in mid-September.
For the other half of the local economic picture, see our monthly West Oxfordshire house prices report, where the average home lost £6,271 of value over the year to June, and our weekly list of Witney planning applications.
Update, 16 September 2026: in its August release the ONS revised West Oxfordshire’s July 2026 claimant count from 1,350 to 1,310, and the number aged 16 to 24 from 250 to 240. On the revised figure July is no longer the highest for under-25s since December 2021, because March and May 2026 both recorded 245. The rise on July 2025 becomes 35, or 17.1 per cent, and West Oxfordshire remains the only Oxfordshire district where under-25 claims rose. The figures above are as first published. The August figures are in our August claimant count report.
Have your say